COVID-19 | 2021-01-11 |
Coronavirus | 18:20 Pacific |
United States | |
California - COVID deaths - disabled vs able - May to December 2020 | |
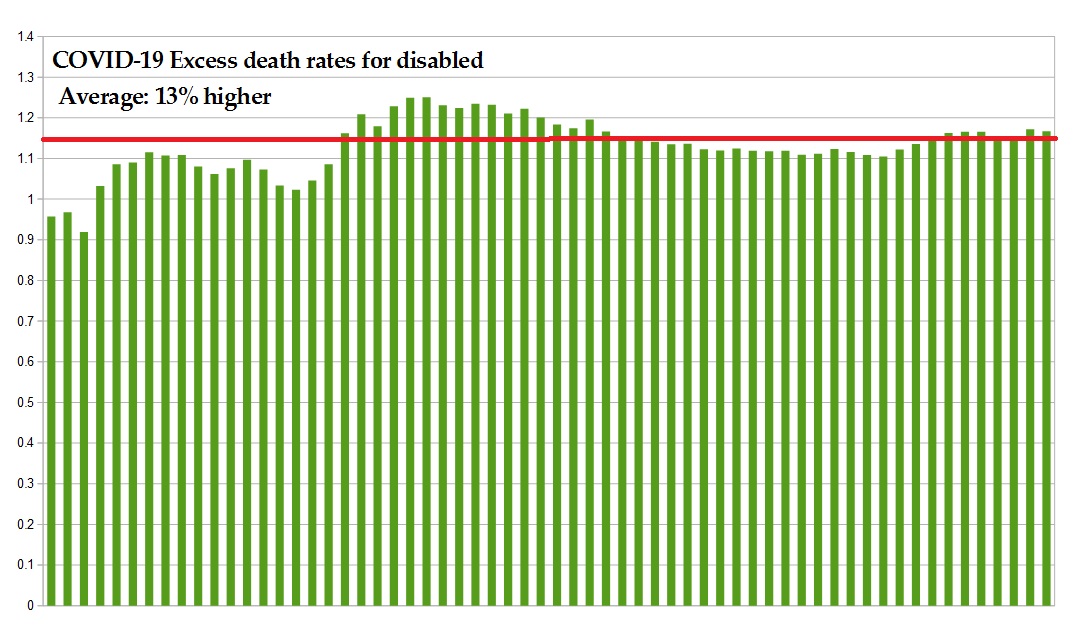
The red horizontal line above is the average of 13% more deaths for disabled Californians than neurotypical Californians . |
|
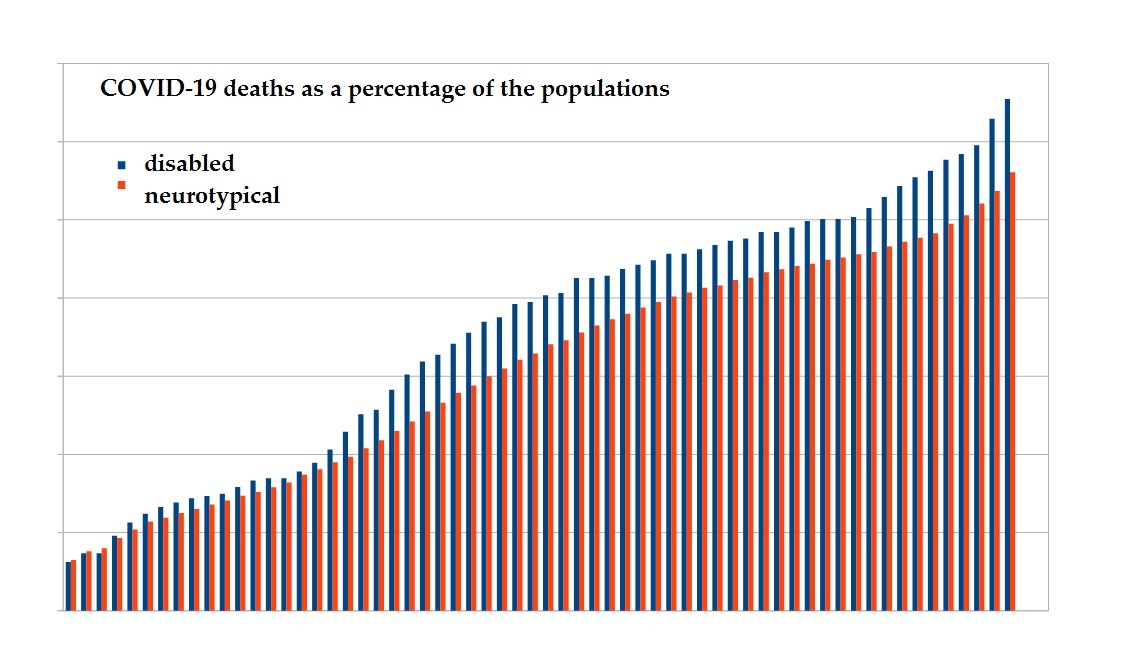
A disturbing trend that appears when percentages of COVID-19 deaths for neurotypical versus disabled are plotted on the same chart |
|
is that death percentages are markedly higher for disabled people. | |
Back to COVID cases and deaths for people with disabilities | |
Back to recent epidemics | |
IMAGSTS Home page |